2016 Investment Review and 2017 Outlook
The US Stock market showed surprising strength and velocity in the eighth year of the current bull market. The S&P 500 returned 11.96% in 2016. This strong performance was driven in part by a 4.98% increase in the S&P 500 since November 9th, the day after the election. The strong post-election results have been driven by optimism on Wall Street. This optimism should not come as a surprise. Recently, every Wall Street analyst in Barron’s predicted an up market for 2017. Unfortunately, if you go back every year since 1998, when Barron’s first published predictions, we see the same result: every analyst predicting an up market. Of course, it is easier to sell products with an optimistic sentiment and a rising stock market. In our view, there is a potential conflict of interest when Wall Street manages money and is trying to sell their own products.
Wall Street’s annual optimism, in our view, creates two major problems. First, they aren’t looking for early signs from the market that a pullback is happening. Second, their bureaucratic structure makes it slow for them to adjust portfolios when the pullback happens. We believe that our current asset allocation continues to provide protection in the event of a pullback. We continue to recommend significantly overweighting US stocks compared to international stocks. This asset allocation worked well in 2016 with US Large Cap returning 11.96%, US MidCap returning 20.74% and US Small Cap returning 26.56%. This compares to International Stocks returning 4.5% and Emerging Markets returning 10.87%. We continue to favor US Large Cap stocks with a lower P/E ratio than the overall market.
Despite the strong year in equities, fixed income still provided a positive return. The Barclays Aggregate Bond Index returned 2.65% for 2016. Protecting the portfolio for inflation paid off in 2016 with Treasury Inflation Protected Securities returning 4.68% for 2016. The traditionally riskier asset classes of fixed income provided stronger returns for the year. High Yield returned 13.41% and Emerging Market Bonds returned 9.26%. We still feel that most investors don’t understand the risk in these fixed income asset classes which has been distorted with governments purchasing bonds. We recommend avoiding High Yield and Emerging Market Bonds in 2017.
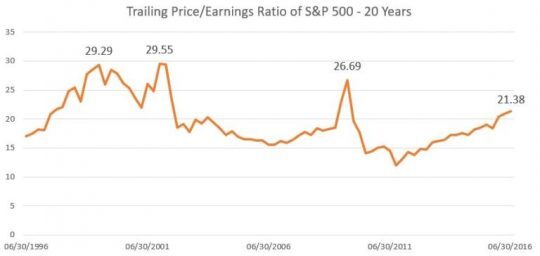
The historic optimism of Wall Street is why we don’t use forward earnings when valuing companies or the stock market. We prefer to look at the actual earnings of companies and the overall market. Over the last 12 months the S&P 500 has earned roughly $101 a share. If you take the value of the S&P 500 at the end of 2016 it was 2238.83. This gives you a trailing Price/Earnings (P/E) ratio of 22.17. Over the last 10 years the average trailing P/E has been 17.14.

Source: S&P Dow Jones Indices
Wall Street’s optimistic earnings estimates vary, but they average approximately $125 per share for the S&P 500. Yes, that is approximately a 25% increase in earnings in 2017. This scenario must assume every positive aspect of the new Trump presidency and ignore any risk. It is true that lower taxes and less regulations will help the economy and most company’s earnings. There is still the risk of getting the legislation passed and the question of how long it takes to implement the legislation and any unintended consequences.
If you use a P/E ratio of 20 to value the S&P 500, which is still higher than the 10-year historical average of 17.4, then you get a target of 2500 for the S&P 500. This would provide a return of 11.67% for 2017. This is our upper range scenario for 2017. We view more realistic earnings estimate for 2017 as $110 a share. If you apply a P/E ratio of 20 to these earnings you get a target of 2200 for the S&P 500 which is a decrease of 1.7% from the end of year level. Finally, if you use the 10-year historical average P/E of 17.14 and earnings of $110 you get a lower range scenario of 1885. This would be a decrease of 15.80% from the end of year level. These assumptions are based on increased earnings and are ignoring some of the worst-case scenarios possible with a Trump presidency. We view any trade wars or tariffs as a negative for the economy and these actions would lower earnings in 2017.
Our upper range scenario is an increase of 11.67% and our lower range scenario is a decrease of 16.61%. Given this outlook, we recommend that investor’s stock exposure is at the lower end of their acceptable equity range. We also caution clients to be prepared for increased volatility in both equity and fixed income markets in 2017.
Investing involves risk, including the possible loss of principal and fluctuation of value. Past performance is no guarantee of future results.
This letter is not intended to be relied upon as forecast, research or investment advice, and is not a recommendation, offer or solicitation to buy or sell any securities or to adopt any investment strategy. The opinions expressed are as of the date noted and may change as subsequent conditions vary. The information and opinions contained in this letter are derived from proprietary and nonproprietary sources deemed by Virtue Asset Management to be reliable. The letter may contain “forward-looking” information that is not purely historical in nature. Such information may include, among other things, projection and forecasts. There is no guarantee that any forecast made will materialize. All information is illustrated gross of investment advisory fees. Reliance upon the information in this letter is at the sole discretion of the reader. Please consult with a Virtue Asset Management financial advisor to ensure that any contemplated transaction in any securities or investment strategy mentioned in this letter align with your overall investment goals, objectives and tolerance for risk. Additional information about Virtue Asset Management is available in its current disclosure documents, Form ADV and Form ADV Part 2A Brochure, which are accessible online via the SEC’s investment Adviser Public Disclosure (IAPD) database at www.adviserinfo.sec.gov, using CRD#283438.
Virtue Asset Management is neither an attorney nor an accountant, and no portion of this content should be interpreted as legal, accounting or tax advice.
