2017 First Half Review and Second Half Outlook
The first half of the year continued the seven-year bull market for stocks with the S&P 500 up 9.17%. Virtue Asset Management continues to recommend over-weighting US Large Cap stocks versus US Mid Cap and US Small Cap. This allocation worked well for the first half of the year with US Mid Cap returning 7.68% and Small Cap returning 4.99%. The first half of the year saw strong performance outside of the US with International Stocks returning 14.57% and Emerging Markets returning 18.8%. Fortunately, India did better than the Emerging Market Index and returned 20.19%.
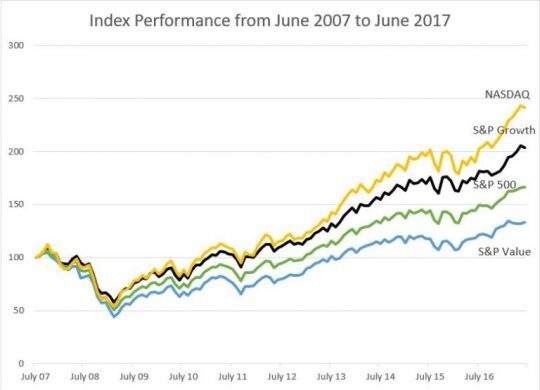
The increase in the S&P 500 was powered by growth stocks and overall earnings growth. Earnings in the first quarter for the S&P 500 were $28.21 versus $23.97 for the previous year – an increase of approximately 20%. The S&P 500 growth index returned 13.33% for the first six months of the year compared to the S&P 500 value index that returned 4.85%. The strong performance of growth was helped by the 35% weighting in technology. For the first six months of the year the NASDAQ, which has a 44% weighting in technology, returned 14.07%.

The month of June saw a change in the trend as the S&P 500 Value Index returned 1.9% while S&P 500 Growth Index returned -.39%. Currently, the Price to Earnings (P/E) ratio on the S&P 500 Growth Index is 25.14 compared to the P/E ratio on the S&P 500 Value Index at 18.4. It is possible that June was the beginning of a rotation from growth to value. Historically, value has outperformed growth over the long term. As displayed in the above chart, the last 10 years have seen growth index returning 8.96% annually versus value index returning 5.24% annually. Currently, we favor stocks with value characteristics given the lower valuation and lower performance of value over the last 10 years versus growth. It is not uncommon for growth to significantly outperform value for select time periods. In 1997 to 1999 the growth index returned 34.76% a year versus the value index which returned 18.16% a year. Of course, that period was the dot com bubble and eventually that bubble popped. The annual performance of the value index from 1997 to 2006 was 9.08% versus the growth index returning only 6.95%.
It is important to understand the underlying holdings in a portfolio and the potential risk of these holdings. In the extreme example of the dot com bubble bursting from 1999-2002, a portfolio of 60% invested in the NASDAQ was riskier than a portfolio that was invested 100% in the S&P 500. From 2000-2002 the 60% Nasdaq portfolio would have been down 32% versus the 100% S&P 500 portfolio down 31%.
Virtue Asset Management is not a value only firm but our individual stock picks tend to have more value characteristics. When we invest in a stock we imagine that we are buying that company and try to model earnings growth to project how many years before we would receive our initial investment back and then earn a profit. When we look at a company such as Amazon we look at a market cap of $450 billion. In a simplistic exercise, versus our more complex model, you can calculate the average earnings needed to receive your original investment back before profits. For a company that is $450 billion market cap, to receive your initial investment back you would need to average earnings of $45 billion a year for a 10 year span. Last year Amazon had earnings of $2 billion. If you stretch the time horizon out to 20 years you would need a return of $22.5 billion a year which is still ten times the profit Amazon made last year. At Virtue Asset Management we want to own companies that have a shorter time horizon to return the individual investment and that don’t rely on such high growth assumptions. We believe these more conservative companies will protect more on the downside in the event of a market pullback.
Fixed Income continues to provide low but positive returns. The Barclays Aggregate Bond Index returned 2.42% for the first half of the year. The preferred stock index had a better performance and returned 4.51% for the first half of the year. We continue to recommend holdings in preferred stock for fixed income because of the higher dividend payouts. We don’t expect the Federal Reserve to raise rates to a level high enough that other products will compete with the four to five percent coupon that the preferred stocks are currently offering.
The strong earnings of the first quarter has raised earnings estimates for the S&P 500 Index in 2017 to approximately $128. At the beginning of the year we applied a P/E ratio of 20 to set the upper bound target for the S&P 500. Using the P/E ratio of 20 brings the end of year target of the S&P 500 up to 2560 for an increase of 5.6% from the end of second quarter level. If you use the 10-year historical average P/E of 17.14 and earnings of $128 you get a lower range scenario of 2197. This would be a decrease of 9.3% from the end of second quarter level.
This limited upside potential is one of the reasons we continue to recommend investor’s stock exposure should be at the lower end of their acceptable equity range. We also recommend that investor’s conduct an in-depth review of the holdings in their account to understand their exposure to growth stocks and the risks such exposure may carry.
Investing involves risk, including the possible loss of principal and fluctuation of value. Past performance is no guarantee of future results.
This letter is not intended to be relied upon as forecast, research or investment advice, and is not a recommendation, offer or solicitation to buy or sell any securities or to adopt any investment strategy. The opinions expressed are as of the date noted and may change as subsequent conditions vary. The information and opinions contained in this letter are derived from proprietary and nonproprietary sources deemed by Virtue Asset Management to be reliable. The letter may contain “forward-looking” information that is not purely historical in nature. Such information may include, among other things, projection and forecasts. There is no guarantee that any forecast made will materialize. All information is illustrated gross of investment advisory fees. Reliance upon the information in this letter is at the sole discretion of the reader. Please consult with a Virtue Asset Management financial advisor to ensure that any contemplated transaction in any securities or investment strategy mentioned in this letter align with your overall investment goals, objectives and tolerance for risk. Additional information about Virtue Asset Management is available in its current disclosure documents, Form ADV and Form ADV Part 2A Brochure, which are accessible online via the SEC’s investment Adviser Public Disclosure (IAPD) database at www.adviserinfo.sec.gov, using CRD#283438.
Virtue Asset Management is neither an attorney nor an accountant, and no portion of this content should be interpreted as legal, accounting or tax advice.
