2017 Third Quarter Review
The strength of the stock market continued in the third quarter. The S&P 500 Index was up 4.48% for the quarter and 14.24% for the year. The strength in U.S. Large Cap as measured by the S&P 500 Index was driven by the S&P 500 Growth Index with returns of 5.29% for the quarter and 19.33% for the year. This compares favorably to the S&P 500 Value Index with returns of 3.48% for the quarter and 8.49% for the year.
The S&P 500 Index has significantly outperformed the S&P Mid Cap 400 Index with a return of 9.40% year to date and the S&P Small Cap 600 Index with a return of 8.92% year to date. Based on valuation, Virtue Asset Management continues to recommend overweighting exposure to Large Cap stocks compared to Mid and Small cap stocks. International Stocks have continued their strong performance of 2017 with a return of 5.35% for the third quarter and 19.94% year to date.
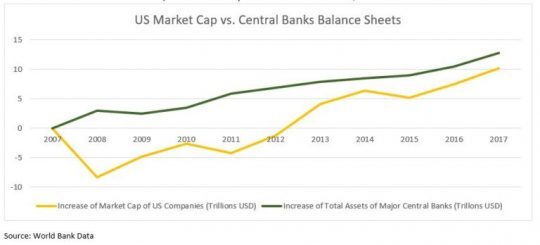
In a response to the financial crisis of 2007-08 the U.S Central Bank implemented several rounds of quantitative easing by purchasing fixed income securities composed of U.S Treasury and Mortgage-Backed securities. The U.S. purchased over $3 trillion of securities from 2008 to 2014 and has rolled over maturing securities – using the proceeds of matured securities to buy additional securities. This process has led the U.S. Central Bank to hold just over $4.2 trillion in fixed income securities. The U.S. was not the only central bank to try this policy. The European Central Bank, the People’s Bank of China and the Bank of Japan have purchased a mixture of equites and fixed income for a total of $15.1 trillion. Combined with the U.S Central Bank, the total assets purchased since 2008 are $19.3 trillion.

The result of Global Central Banks purchasing $19.3 trillion of assets is that they have lowered the supply of investable assets. This decrease in supply drove up the prices of fixed income instruments, which lowered the interest rates available on fixed income securities. The lower rates provided by fixed income securities encouraged some investors to rotate investments from fixed income to equities. In fact, the U.S. Stock market saw an increase of market capitalization of almost $16 trillion from 2008 to 2017
In September, the U.S. Central Bank announced the gradual unwinding of their $4.2 trillion fixed income balance sheet. The process will begin by not reinvesting maturing bonds. Starting in October, at an initial rate of $10 billion per month and increasing to a maximum of $50 billion per month in October 2018. At a rate of $50 billion a month or $600 billion a year it will take until 2025 to completely unwind the balance sheet. In fact, the Bank of Japan has been making purchases of approximately $50 billion a month. This makes it likely that the total assets purchased by global Central Banks could still rise over $19.3 trillion in the medium-term.
The S&P 500 has now gone over 300 days since experiencing a 5% drawdown during a six-month trailing period. There have only been four periods in history where more time has passed without a 5% correction. If the market can go to January without a 5% drawdown it will be the longest period in history. We continue to believe one of the major factors to the strength in the stock market has been purchases of assets by major Central Banks since 2009.
Investors are entering uncharted territory with the U.S. slowly unwinding their balance sheet. At some point the supply of investible assets will increase and some of the $19.3 trillion will have to be purchased by investors instead of Central Banks. The question is how much appetite is there for more investible assets? Is a trillion dollars enough to drive asset prices lower? Is it $10 trillion? At Virtue Asset Management were trying to create portfolios that protect on the downside and make sure our clients are prepared for a possible pullback during this monetary experiment. We continue to recommend clients review their exposure to growth stocks versus value stocks and that their stock exposure should be at the lower end of their acceptable range.
Investing involves risk, including the possible loss of principal and fluctuation of value. Past performance is no guarantee of future results.
This letter is not intended to be relied upon as forecast, research or investment advice, and is not a recommendation, offer or solicitation to buy or sell any securities or to adopt any investment strategy. The opinions expressed are as of the date noted and may change as subsequent conditions vary. The information and opinions contained in this letter are derived from proprietary and nonproprietary sources deemed by Virtue Asset Management to be reliable. The letter may contain “forward-looking” information that is not purely historical in nature. Such information may include, among other things, projection and forecasts. There is no guarantee that any forecast made will materialize. All information is illustrated gross of investment advisory fees. Reliance upon the information in this letter is at the sole discretion of the reader. Please consult with a Virtue Asset Management financial advisor to ensure that any contemplated transaction in any securities or investment strategy mentioned in this letter align with your overall investment goals, objectives and tolerance for risk. Additional information about Virtue Asset Management is available in its current disclosure documents, Form ADV and Form ADV Part 2A Brochure, which are accessible online via the SEC’s investment Adviser Public Disclosure (IAPD) database at www.adviserinfo.sec.gov, using CRD#283438.
Virtue Asset Management is neither an attorney nor an accountant, and no portion of this content should be interpreted as legal, accounting or tax advice.
