2018 First Half Review and Outlook
The eight-year bull market was barely extended in the first half of 2018. Virtue Asset Management continues to recommend that investors maintain their stock exposure at the lower end of their target range. For the full year, we expect the S&P 500 to have returns in the range of negative single digits to positive single digits. We believe the most influential variable to returns for the remainder of the year is the trade negotiations between the U.S. and major trading partners: China, the European Union, Canada and Mexico. We continue to recommend underweighting both International and emerging market stock exposure compared to U.S. holdings. For fixed income, we recommend that investors match upcoming cash flow needs with high quality bonds that mature at the time of their cash flow needs.
For the first half of 2018, the S&P 500 returned 2.65%. In the second quarter, the stock market exhibited lower volatility than the first quarter. Growth stocks continued to provide a better return than value stocks. The S&P 500 Growth Index returned 7.28% in the first half compared to the S&P 500 Value Index that returned -2.22% in the first half. Over the last nine years, the S&P 500 Growth Index has returned 16.56% a year versus the S&P 500 Value Index which has returned 13.60% a year. This is the longest period that growth has outperformed value.
The S&P 500 Growth Index and the S&P 500 continued to be powered by technology stocks. The NASDAQ Index returned 8.79% in the first quarter. The Technology sector currently composes 25% of the S&P 500 index. This is the highest weighting for the Technology sector since 1999 when it was 29%. The S&P 500 counts Amazon and Netflix as Consumer Discretionary companies. If these two companies were added to the Technology sector the weighting would be just under 28%.

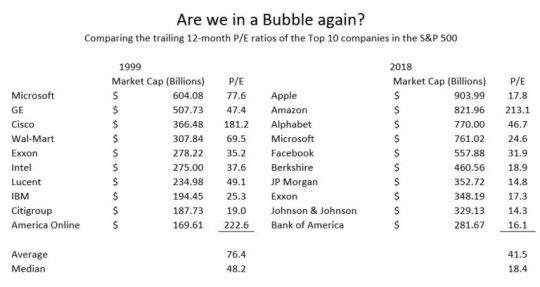
Fortunately, valuation for most companies in 2018 are more reasonable than compared to the Dot-Com bubble of 1999. In 1999, the top 10 companies in the S&P 500 averaged a trailing 12-month (TTM) Price/Earnings ratio (P/E) of 76.4 and had a median TTM P/E of 48.2. Currently, the top 10 companies in the S&P 500 average a TTM P/E of 41.5. However, the median TTM P/E is only 18.4.
In our view, the difference between 1999 and today is that the high P/E ratios are currently concentrated in a few high-flying stocks. We are still able to find stocks that are either undervalued or fairly valued. An important lesson from the high P/E ratios of 1999 is that valuation matters. If you had purchased either Microsoft or Exxon Mobil in 1999 at their high P/E levels, over the last 18 years you would have received returns drastically lower than the S&P 500.
The second quarter saw an increase in the rhetoric from Washington about the U.S. trade deficit. The announcements of tariffs from the U.S. and retaliatory tariffs from other nations have been a drag on the return of the stock market. A positive scenario for the stock market would be the removal of the new tariffs before the mid-term elections and the U.S. receiving a few concessions from their trading partners. The risk to the stock market is that trade wars slow both the global economy and earnings.
The fear of a trade war has negatively affected specific asset classes. In the first half of the year, the Emerging Markets Index returned -6.93%; international stocks returned, as measured by the MSCI EAFE Index, -2.71%. Small Cap stocks traditionally have earned most of their revenue in the U.S. This feature makes them less exposed to retaliatory tariffs from other countries. This is one of the reasons why the Small Cap Index was up 9.39% for the first half of the year. The Mid Cap Index was slightly better than the Large Cap Index as measured by the S&P 500 and returned 3.49% for the first half of the year.
The fixed income market provided negative returns in the first half of the year. The Barclays U.S. Aggregate Bond Index returned -1.62% for the first half of the year. We recommend a shorter maturity for fixed income holdings due to our concern of interest rate hikes and the risk of rising inflation. We continue to recommend avoiding the high yield and emerging market debt based on valuations.
In the first half of 2018, the companies in the S&P 500 continued to report strong earnings and future earnings estimates. Current analysts’ estimates for 2018 are at $148 a share. Currently, the P/E for the S&P 500 is 21.61. The ten-year trailing P/E ratio is currently at 17.89. If we use a P/E ratio of 17.89 with $148 in earnings, the S&P 500 Index would be at 2647 or 3% lower than the close in the first half. If the P/E ratio moves down to 20 and we use earnings of $148, the S&P 500 Index would be at 2960 or 9% higher than the close in the first half. Given the current risk/rewards profile for the rest of the year, we recommend investors maintain their stock exposure at the lower end of their target range.
Investing involves risk, including the possible loss of principal and fluctuation of value. Past performance is no guarantee of future results.
This letter is not intended to be relied upon as forecast, research or investment advice, and is not a recommendation, offer or solicitation to buy or sell any securities or to adopt any investment strategy. The opinions expressed are as of the date noted and may change as subsequent conditions vary. The information and opinions contained in this letter are derived from proprietary and nonproprietary sources deemed by Virtue Asset Management to be reliable. The letter may contain “forward-looking” information that is not purely historical in nature. Such information may include, among other things, projection and forecasts. There is no guarantee that any forecast made will materialize. All information is illustrated gross of investment advisory fees. Reliance upon the information in this letter is at the sole discretion of the reader. Please consult with a Virtue Asset Management financial advisor to ensure that any contemplated transaction in any securities or investment strategy mentioned in this letter align with your overall investment goals, objectives and tolerance for risk. Additional information about Virtue Asset Management is available in its current disclosure documents, Form ADV and Form ADV Part 2A Brochure, which are accessible online via the SEC’s investment Adviser Public Disclosure (IAPD) database at www.adviserinfo.sec.gov, using CRD#283438.
Virtue Asset Management is neither an attorney nor an accountant, and no portion of this content should be interpreted as legal, accounting or tax advice.
Source: Best Financial Advisors in Oak Park | Certified Wealth & Fiduciary Planner | Virtue Asset Management
