
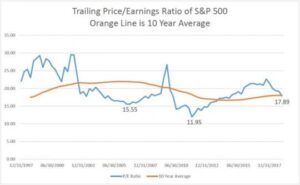
In 2018, the bull market’s nine-year stretch ended. The S&P 500 Index finished 2018 down 4.38%. The negative return was driven by a 13.52% decrease in the fourth quarter. The final earnings for the S&P 500 for 2018 haven’t been reported as of now, but they are expected to be 28% higher than earnings reported in 2017. The negative return of the S&P 500 was driven by a price to earnings (P/E) compression. At the start of 2018 the P/E ratio was 24.33 and currently the P/E ratio is 17.89. If we see stronger earnings in the first quarter or an oversold market, we may start moving equity levels up to neutral from the low end of the target equity range.
 There are a few factors that contributed to the P/E compression in 2018. One of those factors was the Federal Reserve increasing the federal funds rate in 2018. Another factor is the worry of a prolonged trade war with China and increased tariffs that could lead to lower earnings in 2019. Finally, a third factor is the stability of the Trump administration due to Democratic control of the House and recent resignations of Trump advisors.
At Virtue Asset Management we continue to recommend overweighting US Large Cap equity versus US Mid and Small Cap equity based on valuation. In the US for 2018, the Large Cap Index, as measured by the S&P 500, returned -4.38% and outperformed both the Mid-Cap Index, which returned -11.08%, and the Small Cap Index, which returned -8.48%.
Once again, US Equities had better performance than International Equities. We continue to recommend overweighting US Equities compared to International Equities.
International Equities as measured by the EAFE Index returned -13.83% for 2018. Emerging Markets were the worst performing asset class with a return of -14.98%, as measured by the MSCI Emerging Markets Index. The Index was hurt by a decrease in the MSCI China Index of -19.18%. In Emerging Markets, we continue to recommend investing solely in India which returned -7.44% and provided a relative return better than the Emerging Markets Index and the MSCI China Index.
Surprisingly, one theme that continued in 2018 was the outperformance of the S&P 500 Growth Index versus the S&P 500 Value Index. In 2018, the Growth index returned –.01% versus the return of -8.95% for the Value Index. Since 2009, the Value Index has only outperformed the Growth Index once – that year was 2012. The fourth quarter saw the Value Index slightly outperform with a decrease of 12.04% versus a decrease of 14.71% for the Growth Index. The S&P 500 Growth Index has a P/E ratio of 27.32 and the S&P 500 Value Index has a P/E of 16.33. Currently, we believe that value stocks offer a better risk/reward profile than growth stocks.
One of the factors contributing to the fourth quarter pullback in the equity markets was the Federal Reserve. In 2018, the Federal Reserve increased the federal funds rate with four .25% rate hikes raising the rate to 2.5%. In the December meeting, market participants were hoping for a pause in the increase in rates or language forecasting a pause in raising rates in 2019. Instead, the Fed raised rates and forecasted two more rate hikes at .25% each. The market is forecasting a 34% chance of a rate cut by December 2019. A major question for 2019 is who is correct about future interest rate increases: The Federal Reserve or the market. Higher interest rates provide competition for equity investments and in the past have led to a lower P/E ratio. Higher interest rates will increase the cost of debt for companies. The higher interest payments can be a contributing factor to lower future earnings.
The same factors that contributed to the volatility in the equity market contributed to the volatility of the fixed income market. For 2018, the yield on the 10-year government treasury had a low of 2.44% reached in January and a high of 3.24% reached in November. A worrisome sign for some investors was the inversion of the yield curve at the end of the year. On the last day of the year the two-year government bond closed at 2.63% and the five-year bond closed at 2.59%. As we mentioned in our third quarter letter, James Bullard, the President of the St. Louis Fed said that inversion of the yield curve is one signal he is watching. Bullard believes an inverted yield curve has been a good predictor of a recession and a signal that the Federal Reserve should not raise rates.
The rising interest rates of 2018 led to a return of .01% for the Barclays Aggregate Bond Index. The High Yield Bond Index returned -1.93% for the year. We continue to recommend avoiding high yield and emerging market Bonds because of the unfavorable risk/reward profile. We recommend that investors match upcoming cash flow needs, including required minimum distributions, with high quality bonds that mature at the time of the cash flow needs. This strategy will protect the overall portfolio from selling equities at a low price to fund upcoming cash flow needs.
A lower P/E valuation and inverted yield curve point to a market that is projecting a drop in earnings for 2019. It is quite possible the tailwind to earnings that China has provided over the last decade could finally provide a headwind to earnings for companies in the S&P 500. The last time we saw earnings flat or decrease year over year was 2012 versus 2011. In 2012, the P/E of the S&P 500 Index dropped to 11.95. In hindsight, this low P/E valuation this was a great buying opportunity for the S&P 500 Index at 1131.42 – less than half its current value. Over the last ten years the P/E has averaged 17.98 and over the last twenty years the P/E has averaged 19.51.
Analysts continue to be optimistic, as they always are at the beginning of the year and are projecting earnings of $156 for the S&P 500 Index for 2019. The earnings for 2018 should end up at approximately $140. Using the P/E of the last 10 years (17.98) multiped by earnings of $156 provides a target of 2805 and a return of approximately 12%. Our lower range for the S&P 500 is assuming no increase in earnings and using the $140 times a P/E of 15 for a low-end target of 2100 or a decrease of 16%. Given the current risk of a 16% drop compared to the reward of 12% we recommend that investors maintain their stock exposure at the lower end of their target range with more exposure to value stocks. If we see stronger earnings in the first quarter or an oversold market, we may start moving equity levels up to neutral from low end of the target equity range.
There are a few factors that contributed to the P/E compression in 2018. One of those factors was the Federal Reserve increasing the federal funds rate in 2018. Another factor is the worry of a prolonged trade war with China and increased tariffs that could lead to lower earnings in 2019. Finally, a third factor is the stability of the Trump administration due to Democratic control of the House and recent resignations of Trump advisors.
At Virtue Asset Management we continue to recommend overweighting US Large Cap equity versus US Mid and Small Cap equity based on valuation. In the US for 2018, the Large Cap Index, as measured by the S&P 500, returned -4.38% and outperformed both the Mid-Cap Index, which returned -11.08%, and the Small Cap Index, which returned -8.48%.
Once again, US Equities had better performance than International Equities. We continue to recommend overweighting US Equities compared to International Equities.
International Equities as measured by the EAFE Index returned -13.83% for 2018. Emerging Markets were the worst performing asset class with a return of -14.98%, as measured by the MSCI Emerging Markets Index. The Index was hurt by a decrease in the MSCI China Index of -19.18%. In Emerging Markets, we continue to recommend investing solely in India which returned -7.44% and provided a relative return better than the Emerging Markets Index and the MSCI China Index.
Surprisingly, one theme that continued in 2018 was the outperformance of the S&P 500 Growth Index versus the S&P 500 Value Index. In 2018, the Growth index returned –.01% versus the return of -8.95% for the Value Index. Since 2009, the Value Index has only outperformed the Growth Index once – that year was 2012. The fourth quarter saw the Value Index slightly outperform with a decrease of 12.04% versus a decrease of 14.71% for the Growth Index. The S&P 500 Growth Index has a P/E ratio of 27.32 and the S&P 500 Value Index has a P/E of 16.33. Currently, we believe that value stocks offer a better risk/reward profile than growth stocks.
One of the factors contributing to the fourth quarter pullback in the equity markets was the Federal Reserve. In 2018, the Federal Reserve increased the federal funds rate with four .25% rate hikes raising the rate to 2.5%. In the December meeting, market participants were hoping for a pause in the increase in rates or language forecasting a pause in raising rates in 2019. Instead, the Fed raised rates and forecasted two more rate hikes at .25% each. The market is forecasting a 34% chance of a rate cut by December 2019. A major question for 2019 is who is correct about future interest rate increases: The Federal Reserve or the market. Higher interest rates provide competition for equity investments and in the past have led to a lower P/E ratio. Higher interest rates will increase the cost of debt for companies. The higher interest payments can be a contributing factor to lower future earnings.
The same factors that contributed to the volatility in the equity market contributed to the volatility of the fixed income market. For 2018, the yield on the 10-year government treasury had a low of 2.44% reached in January and a high of 3.24% reached in November. A worrisome sign for some investors was the inversion of the yield curve at the end of the year. On the last day of the year the two-year government bond closed at 2.63% and the five-year bond closed at 2.59%. As we mentioned in our third quarter letter, James Bullard, the President of the St. Louis Fed said that inversion of the yield curve is one signal he is watching. Bullard believes an inverted yield curve has been a good predictor of a recession and a signal that the Federal Reserve should not raise rates.
The rising interest rates of 2018 led to a return of .01% for the Barclays Aggregate Bond Index. The High Yield Bond Index returned -1.93% for the year. We continue to recommend avoiding high yield and emerging market Bonds because of the unfavorable risk/reward profile. We recommend that investors match upcoming cash flow needs, including required minimum distributions, with high quality bonds that mature at the time of the cash flow needs. This strategy will protect the overall portfolio from selling equities at a low price to fund upcoming cash flow needs.
A lower P/E valuation and inverted yield curve point to a market that is projecting a drop in earnings for 2019. It is quite possible the tailwind to earnings that China has provided over the last decade could finally provide a headwind to earnings for companies in the S&P 500. The last time we saw earnings flat or decrease year over year was 2012 versus 2011. In 2012, the P/E of the S&P 500 Index dropped to 11.95. In hindsight, this low P/E valuation this was a great buying opportunity for the S&P 500 Index at 1131.42 – less than half its current value. Over the last ten years the P/E has averaged 17.98 and over the last twenty years the P/E has averaged 19.51.
Analysts continue to be optimistic, as they always are at the beginning of the year and are projecting earnings of $156 for the S&P 500 Index for 2019. The earnings for 2018 should end up at approximately $140. Using the P/E of the last 10 years (17.98) multiped by earnings of $156 provides a target of 2805 and a return of approximately 12%. Our lower range for the S&P 500 is assuming no increase in earnings and using the $140 times a P/E of 15 for a low-end target of 2100 or a decrease of 16%. Given the current risk of a 16% drop compared to the reward of 12% we recommend that investors maintain their stock exposure at the lower end of their target range with more exposure to value stocks. If we see stronger earnings in the first quarter or an oversold market, we may start moving equity levels up to neutral from low end of the target equity range.