2018 Third Quarter Review and Outlook
A strong economy continues to overshadow trade tariffs and turmoil in Washington. For the United States, Gross Domestic Product (GDP) growth was a very strong 4.2% in the second quarter. However, earnings for the second quarter were lower than analysts’ predictions. Therefore, the recent returns in the U.S. stock market were powered by P/E (price to earnings) multiple expansions. We recommend investors maintain cautious with their stock exposure.
The third quarter continued the theme of recent years with growth stocks out performing value stocks. Through the third quarter the S&P 500 Growth Index returned 17.24% versus a 3.51% return for the S&P 500 Value Index. Through the third quarter, the returns of all equity asset classes for the United States were strong with the S&P 500 Index returning 10.56%, the S&P MidCap Index returning 7.49% and the S&P SmallCap Index returning 14.54%.
The strong dollar and upcoming trade tariffs have hurt the returns of international and emerging market stocks. Through the third quarter international stocks as measured by the MSCI EAFE Index returned -1.42%. Through the third quarter, the Emerging Market Index returned -8.02%. We continue to recommend underweighting international and emerging stocks in an overall asset allocation.
The S&P 500 Indexes return of 10.56% through the third quarter has been powered by a select group of stocks. The top ten largest contributors made up 7.57% of the 10.56% return. These ten stocks are all in the S&P 500 Growth Index and most of these stocks are technology stocks. This group of ten stocks has an average P/E ratio of 76.99. Below is the list of the top 10 contributors to the returns of the S&P 500 through the third quarter. For example, Amazon tops the list with a 71.27% year to date return. It represents 3.32% of the S&P 500 and has contributed 2.37% return to the 10.54% return of the S&P 500.
| The Best Performing S&P 500 Stocks YTD Are Mostly Growth and Technology Stocks | ||||||
| Holdings | Ticker | Weighting | YTD Return | P/E | Contribution | |
| Amazon.com Inc | AMZN | 3.32% | 71.27% | 158.72 | 2.37% | |
| Apple Inc | AAPL | 4.19% | 34.63% | 20.41 | 1.45% | |
| Microsoft Corp | MSFT | 3.55% | 35.18% | 53.69 | 1.25% | |
| Netflix Inc | NFLX | 0.66% | 94.90% | 170.06 | 0.63% | |
| Mastercard Inc A | MA | 0.82% | 47.57% | 49.8 | 0.39% | |
| Visa Inc Class A | V | 1.08% | 32.19% | 36.7 | 0.35% | |
| NVIDIA Corp | NVDA | 0.69% | 45.46% | 41.02 | 0.31% | |
| Adobe Systems Inc | ADBE | 0.54% | 54.05% | 55.77 | 0.29% | |
| Salesforce.com Inc | CRM | 0.49% | 55.56% | 167.4 | 0.27% | |
| Cisco Systems Inc | CSCO | 0.90% | 29.50% | 16.3 | 0.27% | |
| Average | 50.03% | 76.99 | ||||
| Total | 16.24% | 7.57% | ||||
Over 70% of the return from the S&P 500 index can be contributed to these 10 stocks. These are great companies, but their P/E ratios are almost four times compared to the S&P 500 Index. With valuations this stretched we find it hard to justify purchasing most of these stocks at their current prices. We believe many of these stock valuations have incorporated very high expectations for future growth.
It is not uncommon to see high and possibly unrealistic valuations on stocks. This quarter one stock that was in the news was Tilray, a Canadian cannabis company, that on July 19th an Initial Public Offering (IPO). The stock, which does not have any earnings, started at a $2 billion market cap and reached a $30 billion market cap before crashing down to the current $10 billion market cap. These market swings happened in a matter of weeks. To us, this shows how hard it is to try and value growth companies with little to no earnings. The difference in calculating future growth by one or two percent can literally be billions of dollars in market cap. This valuation uncertainty combined with a fear of missing out is how bubbles are typically blown in both specific stocks and asset classes.
What has worried us about some growth stocks is that you don’t know when the momentum will reverse. In a manner of days Tilray lost 66% percent and $20 billion of its market cap. Another growth stock favorite, Tesla lost approximately $20 billion (30% of value) in market cap because of a single tweet and the subsequent SEC investigation.
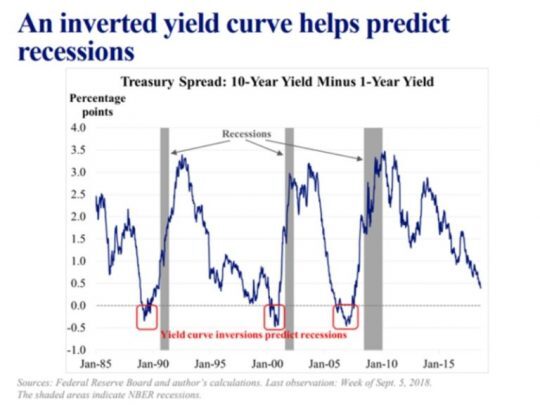
We don’t know what, if any, event could burst the bubble of high valuation stocks. We recently heard James Bullard, the President of the St. Louis Fed speak at a Chicago CFA conference and one signal he is paying attention to is the inverted yield curve. An inverted yield curve means the interest rate on the ten year treasury bond is less than the interest rate of the one year treasury bond. Currently the ten year treasury bond is yielding 3.046% versus 2.699% for the one year treasury. He showed the following chart below and discussed how an inverted yield curve has been a good predictor of a recession.

There is a debate about the effectiveness of the yield curve as an indicator given the distortion of the fixed income market by central bank policies. Bullard recommended that the Federal Reserve look at the yield curve before making decisions about raising the federal fund rate. He remarked that the current yield curve suggests the Federal Reserve is already in a neutral to restrictive stance. Therefore, his view is that the Federal Reserve should be very careful in raising rates going forward.
In the third quarter, the Federal Reserve raised the federal funds rate for the third time this year. These three quarter point raises moved the federal funds rate to a range of 2% to 2.25%. A rising interest rate environment will usually put pressure on bond prices. Currently, Fed officials expect at least three more rate hikes in 2019. The rising interest rates has caused the Barclays US Aggregate Bond Index to return -1.60% through the third quarter. Despite the negative returns in the Bond Index and the potential of upcoming rate hikes, we still view bonds as an important part of every portfolio. We recommend that investors purchase individual bonds and match upcoming cash flow needs with high quality bonds that mature at the time of their cash flow needs.
Current analysts’ estimates for 2018 earnings dropped to $143 a share from the June estimate of $148 a share. Therefore, the growth in the stock market in the third quarter was driven by P/E expansion. Analyst estimates for the 2019 are $163 a share. The ten year trailing P/E ratio is now 17.95 and that would create a target of 2,925 essentially flat for 2019. If the market is willing to pay a 20 times P/E ratio for earnings that would create a target of 3,260 for the S&P 500 or a return of approximately 11%. Given the current risk/rewards profile for 2019, we recommend investors maintain their stock exposure at the lower end of their target range.
Investing involves risk, including the possible loss of principal and fluctuation of value. Past performance is no guarantee of future results.
This letter is not intended to be relied upon as forecast, research or investment advice, and is not a recommendation, offer or solicitation to buy or sell any securities or to adopt any investment strategy. The opinions expressed are as of the date noted and may change as subsequent conditions vary. The information and opinions contained in this letter are derived from proprietary and nonproprietary sources deemed by Virtue Asset Management to be reliable. The letter may contain “forward-looking” information that is not purely historical in nature. Such information may include, among other things, projection and forecasts. There is no guarantee that any forecast made will materialize. All information is illustrated gross of investment advisory fees. Reliance upon the information in this letter is at the sole discretion of the reader. Please consult with a Virtue Asset Management financial advisor to ensure that any contemplated transaction in any securities or investment strategy mentioned in this letter align with your overall investment goals, objectives and tolerance for risk. Additional information about Virtue Asset Management is available in its current disclosure documents, Form ADV and Form ADV Part 2A Brochure, which are accessible online via the SEC’s investment Adviser Public Disclosure (IAPD) database at www.adviserinfo.sec.gov, using CRD#283438.
Virtue Asset Management is neither an attorney nor an accountant, and no portion of this content should be interpreted as legal, accounting or tax advice.
Source: Best Financial Advisors in Oak Park | Certified Wealth & Fiduciary Planner | Virtue Asset Management
