2019 Review and 2020 Outlook
Most major asset classes generated excellent returns in the fourth quarter. In 2019, the S&P 500 provided one of the largest returns in history. A temporary trade truce with China combined with an accommodative Federal Reserve helped power stocks and bonds higher. Historically, the S&P 500 Index has followed such a strong year with an average return of 7%. However, we’re in year eleven of a bull market, the fourth year of a presidential term and experiencing a slowdown in the manufacturing sector. These signs point to the possibility of a pullback, even if temporary. Therefore, we recommend clients assess the risk of their portfolios and balance it against long term goals. It may be an opportune time to decrease risk and lower equities in their portfolios.

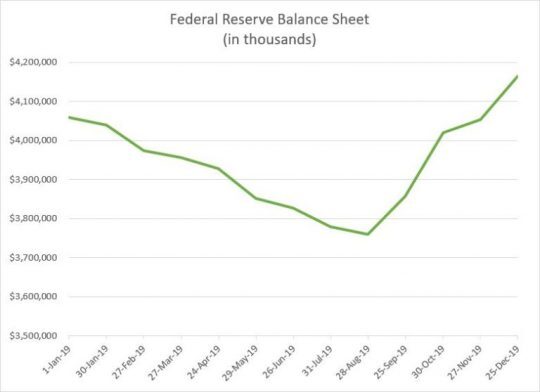
The Federal Reserve provided a lot of the fuel for the large stock and bond returns in 2019. During 2019, the Federal Reserve provided three .25% rate cuts to move the benchmark rate range down to 1.5% to 1.75%. On June 4th, Federal Reserve chairman Jerome Powell said that the central bank was prepared to act to sustain the economic expansion if President Trump’s trade war weakened the economy. On October 11th, in response to issues in the repo market the Federal Reserve announced the monthly purchases of $60 billion in Treasury bills. The Federal Reserve also said it would continue to inject cash into overnight lending markets until January. In August 2019, the total assets of the Federal Reserve balance sheet declined to under $3.8 trillion. By the end of 2019, the total assets of the balance sheet were close to $4.2 trillion. The old adage is “don’t fight the Fed.” The year 2019 proved this point as the rate cuts and cash injections provided a tail wind to the market in the second half. Lower interest rates made stocks look more attractive compared to bonds. Currently, the S&P 500 is yielding approximately 1.7% which is nearly the same interest paid on the 10-year Government treasury. The MSCI EAFE Index is currently yielding over 3%. Low interest rates combined with the increased liquidity provided by the Federal Reserve were part of the reason the price to earnings ratio (using last 12 months of earnings) expanded from 17.89 at the start of the year to 23.07 at the end of the year.
For the year, the S&P 500 Index returned 31.49%. Since 1928, the S&P 500 has returned 25% or better 17 times (admittedly a small sample size). The following year the S&P 500 has averaged a return of 7% with 12 out of the 17 years being positive. The S&P Mid-Cap Index returned 26.2% for the year. The S&P Small Cap Index returned 22.78% for the year. We continue to recommend overweighting large cap stocks versus mid and small cap stocks. The US Barclays Aggregate Bond Index returned 8.72% for the year.
United States equities continued to outperform the rest of the world. International equities, as measured by the MSCI EAFE Index, returned 21.95% for the year. We recommend finding opportunities to add to international stocks and lighten US stocks because of the lower valuation and higher dividend yield. Emerging markets, as measured by the MSCI Emerging Markets Index returned 17.67% for the year.
The signing of the phase one trade deal with China should be a positive factor for the stock market in 2020. As a reminder, due to the competing goals of the United States and China, we don’t believe that any treaty could satisfy the current goals of both nations. We expect the tension to be an underlying trend over a long-time horizon. A major question is if the phase one trade deal will help lift the manufacturing sector out of the current recession. The manufacturing purchasing managers’ index (PMI) from the Institute for Supply Management came in at 47.2% in December, the lowest since June 2009. Any figure below 50% signals a contraction. At this point a healthy consumer willing to spend has offset the manufacturing weakness. Healthy consumer spending should lead to earnings growth for the stock market in 2020. However, the major variable will be consumer confidence in the stock market and the price to earnings (P/E) ratio they are willing to pay for earnings. Several risks including a heightened trade war with China, geopolitical risks in the Middle East and an upcoming election could influence consumer confidence. A loss of consumer confidence, even if temporary, would contribute to a lower P/E ratio and a lower index price.
For 2019, the S&P 500 operating earnings are estimated to be $140.45. The earnings were much lower than the analyst estimates of $157.47 at the start of the year. Therefore, the major driver of performance for the year was the expansion of the price to earnings (P/E) ratio. At the start of 2019, the P/E ratio of the S&P 500 using the last 12 months of earnings was 17.89. Currently, the P/E ratio of the S&P 500 using the last 12 months of earnings is 23.07. Analysts earnings projections for 2020 are at $162 a share for the S&P 500. This is down from $166 at the end of last quarter. We find these projections to be high, but it does show that analysts are not predicting a recession in 2020. Therefore, the risk to the downside is an adjustment to the P/E ratio. A small adjustment to the P/E ratio down to 19.76 times earnings (the 10-year average) would lower the Index to 3200 or approximately 1% lower than the current level. The last five years the P/E ratio has averaged 22.7. Using the P/E of 22.7 multiplied by earnings of $162 for the S&P 500 provides a target of 3677. This optimistic target relies on two major assumptions. First, that investors will continue to use a high multiple on earnings and that analyst earnings are accurate. We have historically found analyst earnings to be overly optimistic at the start of the year. We think that a more conservative 2020 earnings estimate is $150. There is risk that the market uses a more conservative P/E ratio of 18 and the index would be at 2700 or a 17% decrease. We want to make sure clients are emotionally prepared for such a decline. Portfolios should be structured that if a decline of close to 20% happens that clients won’t panic but instead be prepared to become more aggressive. Clients have several options to decrease the risk of their portfolios. A few options include reducing the overall exposure to equities, moving from growth stocks to value stocks, increasing exposure to international stocks and using structured notes to protect their principal. Our most likely scenario for 2020 is mid-single digit equity returns with increased volatility.
Investing involves risk, including the possible loss of principal and fluctuation of value. Past performance is no guarantee of future results.
This letter is not intended to be relied upon as forecast, research or investment advice, and is not a recommendation, offer or solicitation to buy or sell any securities or to adopt any investment strategy. The opinions expressed are as of the date noted and may change as subsequent conditions vary. The information and opinions contained in this letter are derived from proprietary and nonproprietary sources deemed by Virtue Asset Management to be reliable. The letter may contain “forward-looking” information that is not purely historical in nature. Such information may include, among other things, projection and forecasts. There is no guarantee that any forecast made will materialize. All information is illustrated gross of investment advisory fees. Reliance upon the information in this letter is at the sole discretion of the reader. Please consult with a Virtue Asset Management financial advisor to ensure that any contemplated transaction in any securities or investment strategy mentioned in this letter align with your overall investment goals, objectives and tolerance for risk. Additional information about Virtue Asset Management is available in its current disclosure documents, Form ADV and Form ADV Part 2A Brochure, which are accessible online via the SEC’s investment Adviser Public Disclosure (IAPD) database at www.adviserinfo.sec.gov, using CRD#283438.
Virtue Asset Management is neither an attorney nor an accountant, and no portion of this content should be interpreted as legal, accounting or tax advice.
