2022 First Half Review and Outlook
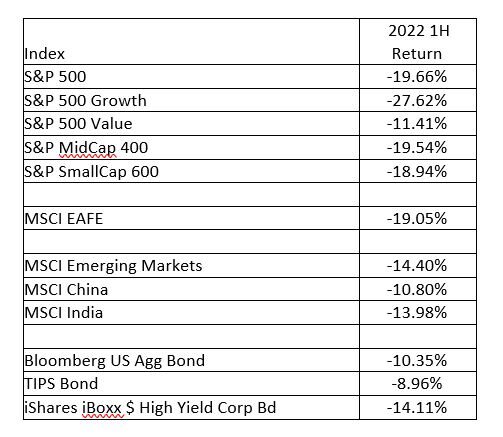
Through the first half of the year the S&P 500 has returned -19.96%. The financial markets are expecting the Federal Reserve to continue to raise interest rates to drive down inflation and cause a recession. The increase in interest rates have driven down bond prices, for the first half of the year the Bloomberg US Aggregate Bond Index returned -10.35%. A pullback in the S&P 500 is not uncommon. In fact, since 1929 the S&P 500 has experienced a drop of 20% or more from recent highs, on average, every 4.2 years. Despite short term risks, we think the lower stock prices and higher interest rates are providing buying opportunities for investors willing to take a longer-term view. We recommend our clients adjust portfolios to move above a neutral equity allocation. Clients that have excess cash should start putting some of it to work in quality stocks and take advantage of the higher interest rates. We recommend that our clients keep between two to four years of upcoming expenses in cash and short-term maturity bonds.
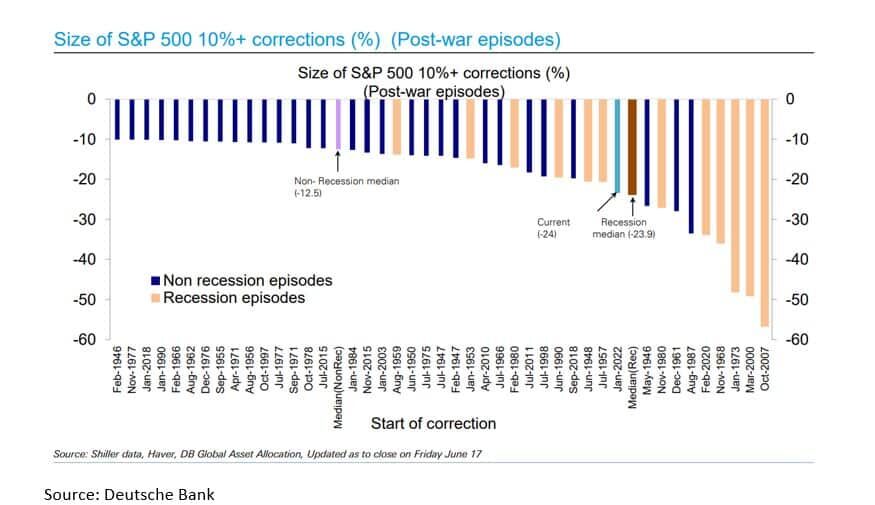
In the chart below you can see all the corrections over 10% for the S&P 500 since World War II. This is the fourth largest non-recession correction since World War II. The typical non-recession correction for the S&P 500 is -12.5%. In fact, on June 17th, the correction of 24% was equal to the median correction during a recession. This correction size shows that the market has already priced in a recession. If the economy does enter a deep recession, the market could see an additional pullback of 10% to 15%. Despite the downside risk, we think it is more likely that any recession will be short and shallow and that the market has overreacted with the current correction.

Federal Reserve chairman Powell has indicated that inflation remains uncomfortably high and they want to reduce inflation by raising interest rates. The Federal Reserve’s preferred inflation gauge is the Personal Consumption Expenditure Index (PCE). The Federal Reserve prefers the PCE price index excluding food and energy. This core index is less volatile than total inflation while having the same average rate over longer periods of time and the same power to predict future inflation. The May increase of the PCE was 6.3% year over year, but the core was 4.7% down from 4.9% in April. These numbers were more encouraging than the Consumer Price Index (CPI). The CPI was up 8.6% year over year in May and the core CPI was up 6%. If the PCE is correct, inflation is slowing and the market is overestimating the amount of rate hikes the Federal Reserve will make the rest of the year.
The current target interest rate of the Federal Reserve is 1.5% to 1.75%. At the June meeting the Federal Reserve Dot Plot predicted that the Federal Funds rate would rise to 3.4% at the end of the year. They hope to lower inflation without triggering a recession with large scale job losses. A rally in the bond market at the end of the quarter indicates that investors are skeptical that the Fed can “thread the needle” and avoid a recession. Yields on 2-year, 5-year and 10-year Treasuries finished the quarter approximately 30bp (.30%) lower than they ended the prior week. The 10-year U.S. Treasury is currently yielding 2.98%. This compares to a rate 1.52% at the beginning of the year, but is lower than the post pandemic high of 3.49% reached earlier this spring. If the economy falls into a recession, unemployment is expected to rise and inflation is expected to moderate. This scenario could cause the Federal Reserve to halt rate increases and even begin to ease monetary policy. A cease fire in Ukraine and the easing of supply chain disruptions could also ease inflation pressure.

The first half of the year has been tough on most investors because most major asset classes are down double digits. In a sign that assets were sold across the board, most equity asset class returns were similar. Historically, in a downturn Small Cap will do worse than Large Cap. However, in the first half of the year they had very similar returns.
A portfolio invested in only fixed income mirroring the Bloomberg US Agg Bond index would have returned -10.35%. Higher interest rates are providing the opportunity to purchase quality taxable bonds with interest rates over 4% and reasonable maturity dates. The High Yield Corporate Bond Index is currently yielding over 8%. The same index was yielding 4% at the beginning of the year. At Virtue Asset Management, we believe this is the time to start adding to these asset classes to take advantage of the higher interest rates.
The drop in the S&P 500 and increase in interest rates point to recession and lower earnings. However, analysts have barely adjusted earnings for 2022. Earnings estimates have decreased from $225 a share to $224 a share. The forward price to earnings (P/E) ratio is currently 16.88 compared to 20 at the beginning of the year. The compression in the P/E ratio explains most of the losses in the S&P 500. The ten-year average for the P/E ratio is 20 and the last time the P/E ratio was at this level was the pullback in the fourth quarter of 2018. The P/E ratio was 16.54 and the S&P 500 was down to 2506 (currently the S&P 500 is at 3812). If we have a shallow and short recession you could see 2023 earnings close to analysts estimates of $250. Using the current P/E ratio of 16.88 would provide a target of 4220 for the S&P 500 – an increase of approximately 11%. Any P/E expansion would only increase the target. Despite the short-term risks, we think the S&P 500 provides long term value at this level. We recommend our clients adjust portfolios to move above a neutral equity allocation. Clients that have excess cash should start putting some of it to work in quality stocks and take advantage of the higher interest rates.
Investing involves risk, including the possible loss of principal and fluctuation of value. Past performance is no guarantee of future results.
This letter is not intended to be relied upon as forecast, research or investment advice, and is not a recommendation, offer or solicitation to buy or sell any securities or to adopt any investment strategy. The opinions expressed are as of the date noted and may change as subsequent conditions vary. The information and opinions contained in this letter are derived from proprietary and nonproprietary sources deemed by Virtue Asset Management to be reliable. The letter may contain “forward-looking” information that is not purely historical in nature. Such information may include, among other things, projection, and forecasts. There is no guarantee that any forecast made will materialize. All information is illustrated gross of investment advisory fees. Reliance upon information in this letter is at the sole discretion of the reader.
Please consult with a Virtue Asset Management financial advisor to ensure that any contemplated transaction in any securities or investment strategy mentioned in this letter align with your overall investment goals, objectives, and tolerance for risk.
Additional information about Virtue Asset Management is available in its current disclosure documents, Form ADV and Form ADV Part 2A Brochure, which are accessible online via the SEC’s investment Adviser Public Disclosure (IAPD) database at www.adviserinfo.sec.gov, using CRD#283438.
Virtue Asset Management is neither an attorney nor an accountant, and no portion of this content should be interpreted as legal, accounting or tax advice.
Investing involves risk, including the possible loss of principal and fluctuation of value. Past performance is no guarantee of future results.
This letter is not intended to be relied upon as forecast, research or investment advice, and is not a recommendation, offer or solicitation to buy or sell any securities or to adopt any investment strategy. The opinions expressed are as of the date noted and may change as subsequent conditions vary. The information and opinions contained in this letter are derived from proprietary and nonproprietary sources deemed by Virtue Asset Management to be reliable. The letter may contain “forward-looking” information that is not purely historical in nature. Such information may include, among other things, projection and forecasts. There is no guarantee that any forecast made will materialize. All information is illustrated gross of investment advisory fees. Reliance upon the information in this letter is at the sole discretion of the reader. Please consult with a Virtue Asset Management financial advisor to ensure that any contemplated transaction in any securities or investment strategy mentioned in this letter align with your overall investment goals, objectives and tolerance for risk. Additional information about Virtue Asset Management is available in its current disclosure documents, Form ADV and Form ADV Part 2A Brochure, which are accessible online via the SEC’s investment Adviser Public Disclosure (IAPD) database at www.adviserinfo.sec.gov, using CRD#283438.
Virtue Asset Management is neither an attorney nor an accountant, and no portion of this content should be interpreted as legal, accounting or tax advice.
Source: Best Financial Advisors in Oak Park | Certified Wealth & Fiduciary Planner | Virtue Asset Management
