First Half 2016: Investment Review & Outlook
The first half of the year was volatile with the S&P 500 down 11.44% on February 11th and up 3.75% on June 8th. The double digit drop in February was fueled by lower oil prices and slower economic growth. The Gross Domestic Product (GDP) for the United States in the 4th quarter of 2015 grew 1.4% and for the 1st quarter of 2016 it grew 1.1%. The stock market, like most people, hates uncertainties. The uncertainties make it harder to value stocks and the market in general. After the Federal Reserve raised rates in December, there was a belief by the market that they would continue to raise rates. The prospect of higher rates, lower economic growth and an upcoming presidential election drove the markets down. In the beginning of the year the market believed we would see fed rate hikes in 2016. This view has changed and the market has now priced in zero rate hikes for the year.
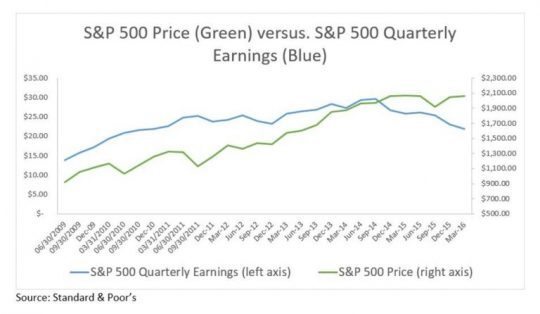
The prospect of continued low rates for the year helped to drive the market from the lows of February with the S&P 500 ending the first half of the year up 2.69 percent excluding dividends. Unfortunately, we have now seen earnings growth decrease in 5 of the last 6 quarters. In the chart below you can see the price of the S&P 500 versus the quarterly earnings of the S&P 500. Quarterly earnings peaked in the 3rd quarter of 2014 while the market reached all-time highs in June of this year.

The price to earnings ratio (P/E) of the S&P 500 is calculated by dividing the price of the S&P 500 (numerator) by the earnings of those companies (denominator). When the earnings (denominator) have stagnated, or gone down, but the market has gone up that means the P/E ratio has increased. On Junes 21st, Janet Yellen mentioned that “[f]orward price-to-earnings ratios for equities have increase to a level well above their median of the past three decades.” This quote brings back memories of Alan Greenspan on December 5, 1996 and his famous “irrational exuberance” quote. The S&P 500 rallied 105% percent from his quote to the peak on March 24, 2000 before experiencing the infamous tech bubble bursting.
We have the self-awareness to recognize that we could never call a top in the market. What we can do is utilize the tools available to us to try and protect our portfolios. The first strategy is to avoid what we view as risky asset classes that are not providing an attractive risk/reward profile. We are avoiding high yield, emerging market debt and most emerging market countries. The second tool is finding individual large cap stocks trading at a lower valuation than the S&P 500. This is why we focus on attractively priced companies that have had a history of book value growth greater than the S&P 500. Finally, when appropriate we can utilize options to protect the downside of stocks, asset classes and portfolios.
There is some optimism for the upcoming 12 months. We will know the results of the presidential election and the results will remove some uncertainty from the stock market. We believe that a significant pull back in the market will lead the Fed to an easier monetary policy. However, the uncertainty of the market has increased with the recent Brexit vote. The Brexit vote combined with the upcoming US presidential election points to more volatility in the next six months. Given valuations and market uncertainty, we are recommending most clients’ portfolios to be positioned at the lower end of their recommended equity range. Until we see growth in earnings, we will continue to keep a conservative stance in our portfolios.
Investing involves risk, including the possible loss of principal and fluctuation of value. Past performance is no guarantee of future results.
This letter is not intended to be relied upon as forecast, research or investment advice, and is not a recommendation, offer or solicitation to buy or sell any securities or to adopt any investment strategy. The opinions expressed are as of the date noted and may change as subsequent conditions vary. The information and opinions contained in this letter are derived from proprietary and nonproprietary sources deemed by Virtue Asset Management to be reliable. The letter may contain “forward-looking” information that is not purely historical in nature. Such information may include, among other things, projection and forecasts. There is no guarantee that any forecast made will materialize. All information is illustrated gross of investment advisory fees. Reliance upon the information in this letter is at the sole discretion of the reader. Please consult with a Virtue Asset Management financial advisor to ensure that any contemplated transaction in any securities or investment strategy mentioned in this letter align with your overall investment goals, objectives and tolerance for risk. Additional information about Virtue Asset Management is available in its current disclosure documents, Form ADV and Form ADV Part 2A Brochure, which are accessible online via the SEC’s investment Adviser Public Disclosure (IAPD) database at www.adviserinfo.sec.gov, using CRD#283438.
Virtue Asset Management is neither an attorney nor an accountant, and no portion of this content should be interpreted as legal, accounting or tax advice.
Source: Best Financial Advisors in Oak Park | Certified Wealth & Fiduciary Planner | Virtue Asset Management
